A Sankey diagram is a flow chart that shows quantities or flows between processes. The arrow width shows the magnitude of the flows. It is useful for analyzing energy and material balances and shows complex relationships in an easily understandable way. Also in the area of finance there are interesting applications.
Since I did not find a Sankey diagram for Blazor, I decided to create a component myself.
The Blazor Sankey diagram should be freely available as open source for everyone.


Content
Objective
For the implementation of the component, a few points are particularly important to me and should definitely be taken into account:
- Flexible use / expandable
- Appealing appearance
- No JavaScript as far as possible
- Must run under Blazor Server as well as Blazor WebAssembly
- Open Source
Implementation
The repository can be found at https://github.com/crispycode-net/BlazorSankey
Much of the code is inspired by d3-sankey by Mike Bostock. The component is an implementation in JavaScript that uses the d3 framework. The easiest way would have been a wrapper around this component to get a Blazor Sankey diagram. There are many good descriptions on how to integrate JavaScript components into Blazor. I don’t want to go into that here.
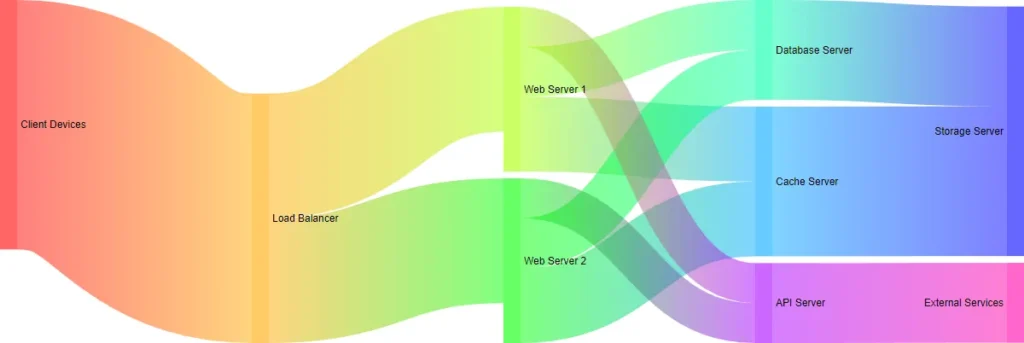
The current state is still very rudimentary, but a few simple use cases should already be possible with the component. After all, the screenshot above is already a real result of the component. Since with open source projects there is always too little time left to implement all wishes, I am happy to accept support in the form of pull requests or suggestions. If you have any questions or suggestions, feel free to write to me or leave a comment here or on GitHub.
Use
The Blazor Sankey Diagram can be loaded from nuget: CrispyCode.BlazorSankey
Using the component in your own projects should be very easy.
- Download the nuget package
- Add a using statement
- Add the component somewhere inside a razor file
- Add data for nodes and links
This is a very basic example:
You define nodes and links – here simply “hard coded” to keep the example simple. Then you insert the component in the Razor of your own application and pass it the references to these nodes and links. In addition, there are the parameters “Width” and “Height” which can be used to define the dimensions of the created diagram in CSS units. The component is structured in such a way that dynamic specifications are converted into their pixel values before the absolute element positions within the SVG element are calculated.
The point “flexible usability” from my objective is currently still exhausted by the fact that the model classes for nodes and links have a few optional parameters that can be used to influence the result.
Node Constructor
Here is the constructor of the Node Model class. A node is represented in the Sankey diagram as a vertical rectangle and is a node from/to which quantities flow out and in:
The value and thus the height of the nodes is calculated from all outflows and inflows. However, you can specify a fixedValue to force a different height for the node. This is important if, for example, you have a start node that is not completely resolved into continuing nodes.
The same scheme can be used to assign fixed colours to the nodes. If you do not enter anything here, the colour box “rainbow” is automatically used. This results in an even distribution of the colouring over the spectrum of the rainbow – looks nice, but certainly does not always fit.
The same applies to the opacity and the text (hoverText), which is displayed in a small pop-up when the mouse moves over the node.
Link Constructor
A quick look at the constructor of the links shows a similar scheme:
Events
At present, the component offers two event callbacks to which you can register your own event handlers: OnNodeClicked and OnLinkClicked. OnNodeClicked is executed when the user clicks on the vertical bar representing the node (not on the text to the node). OnLinkClicked is executed when the user clicks on the Bezier path that represents the link between two nodes.
The callbacks give the respective model object as a parameter:
CSS Classes
Styling via CSS classes is supported at some points in the component. The SVG elements for links follow the hierarchy
- g class links
- g class link
- path class link
- g class link
This makes it possible to achieve a wide range of adjustments via CSS:
Planned extensions
The current scope will probably only withstand manageable application requirements.
The following features are planned for future versions. Feel free to leave a comment or send me a message if you have ideas for further features.
Formatting functions
The output of the texts should be controllable by some kind of pattern. One could use the given and calculated values dynamically in a placeholder.
Reaction to size change
So far, the diagram is not recalculated after the initial query. However, the diagram should recalculate itself when the window size changes.